Analytics
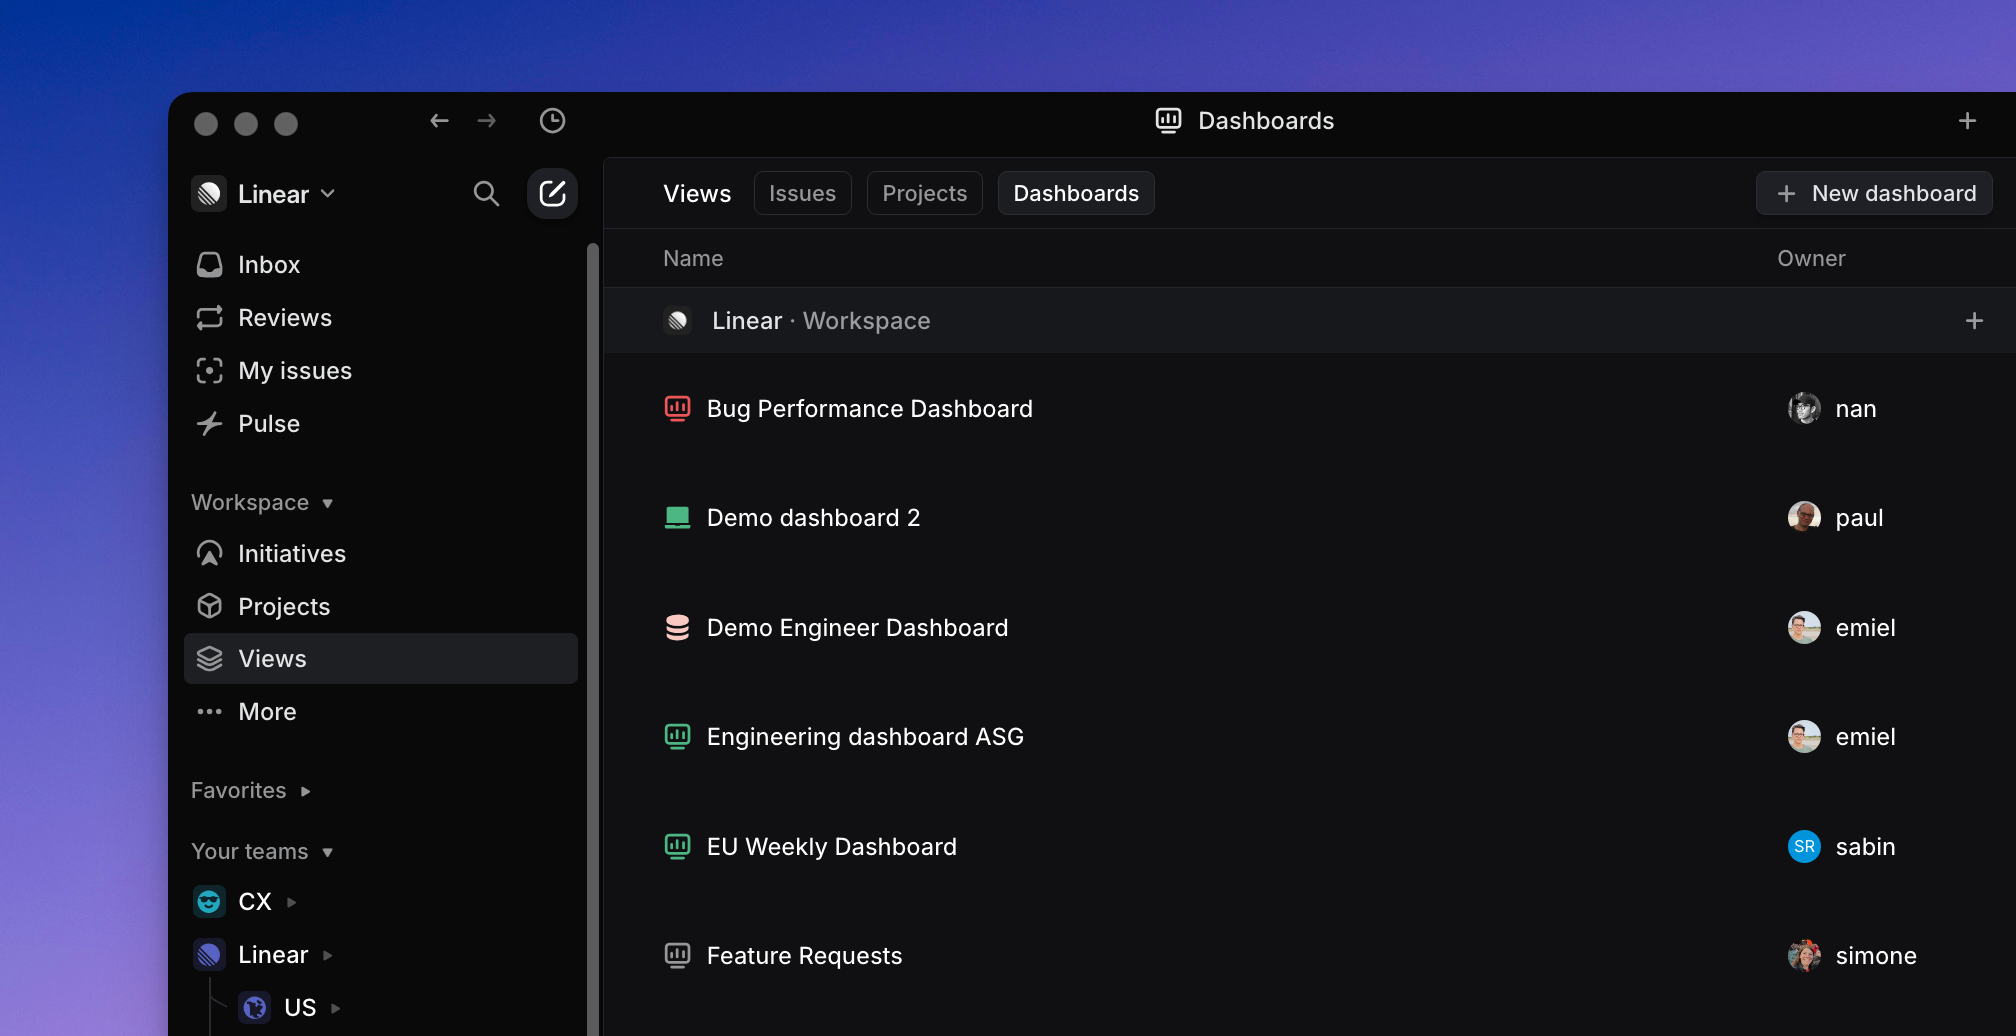
Dashboards
Dashboards let you bring together insights from across teams and projects onto a single page. Use them to track key metrics, monitor trends, and explore data in one place.

Insights
Real-time analytics for all your Linear data. Visualize issue data to spot trends and remove blockers.

Project graph
The graph shows you the progress you're making toward completing your project and estimates when you'll complete it.

Cycle graph
The graph displays the progress you've made in your cycle.
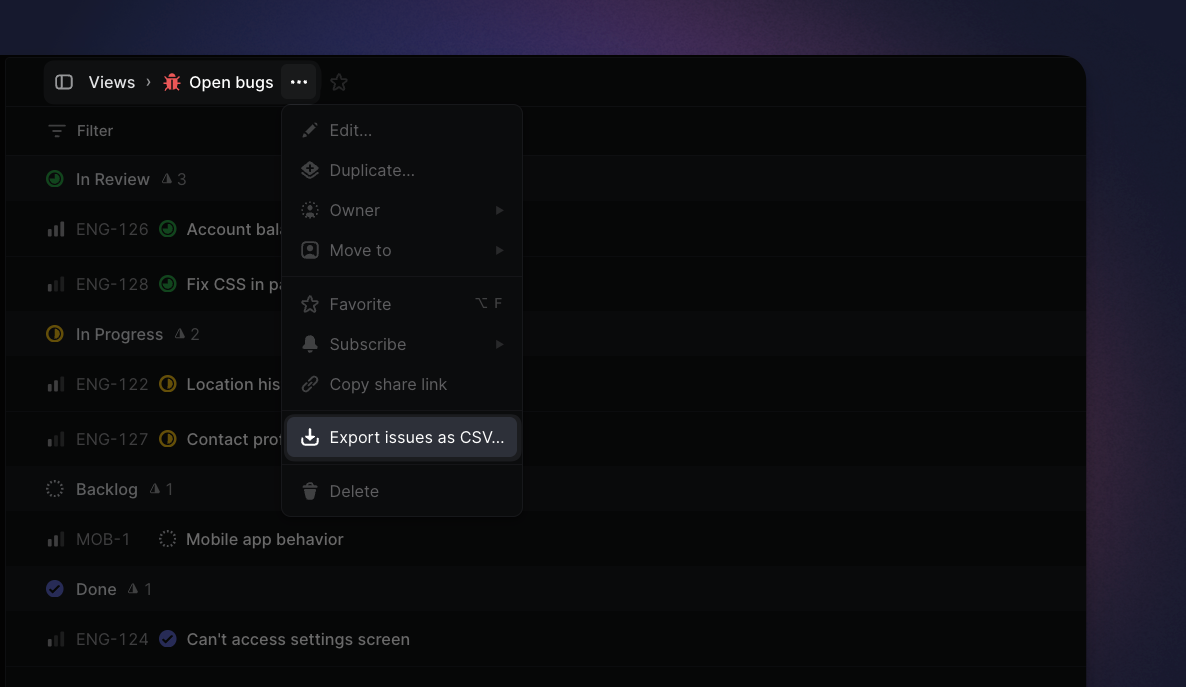
Exporting Data
Export your workspace data using built-in tools, integrations, or the API